Report
The report page is where all of our data on a particular dive can be found. The three main sections are as follows:
- Information (blue background)
- Map (yellow background)
- Graphs (below the information section)
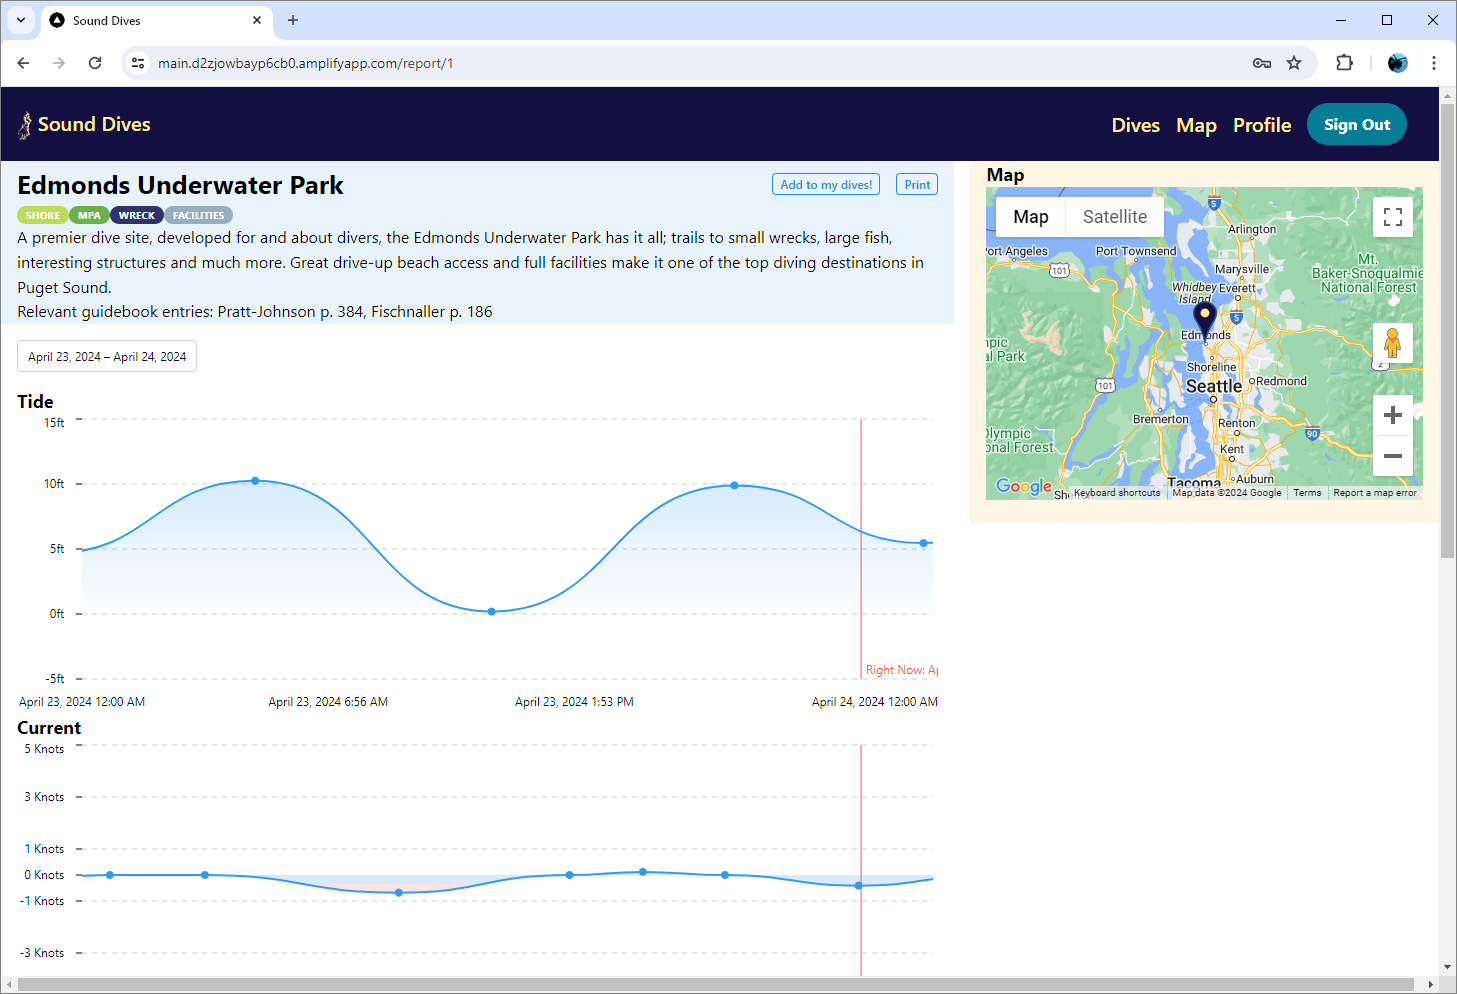 An example Report page.
Information
Basic information on each dive is provided here.
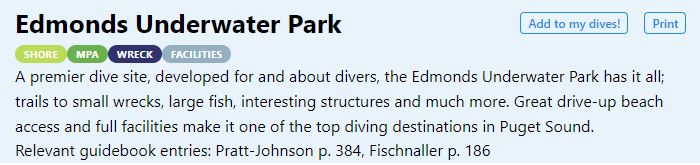
These are the main fields:
- Title: the dive site name, e.g. "Edmonds Underwater Park"
- Tags: dive site attributes, displayed as colorful tags. For more information, see the Dives view info on Tags
- Description: dive site information
- References: page numbers for entries in two local dive guide books.
- Add to my dives!: for users with profiles, this adds the dive to your saved list of dives
- Print: this re-renders the page in printer friendly format and opens up your browser's printing dialog
Guide books
These are the two guidebooks we currently have page number information for:
- Fischnaller, Steve. Northwest Shore Dives. Bio-Marine Images, 2000.
- Pratt-Johnson, Betty. 151 Dives in the Protected Waters of Washington State and British Columbia. Mountaineers Books, 2007.
Map
The map section provides a small display to help orient users looking at a particular dive site. For a larger map that includes other dive sites, please see the Map page
Graphs
The graphs on the report page display up-to-date information on conditions. The red bar displays the current time on your browser. The date range can be modified by selecting from the box on the top left with dates.
Tide
The tide graph displays NOAA predicted tide conditions for the prediction station nearest to the dive site. Note in the image below that the date selection box and red current time line are shown.
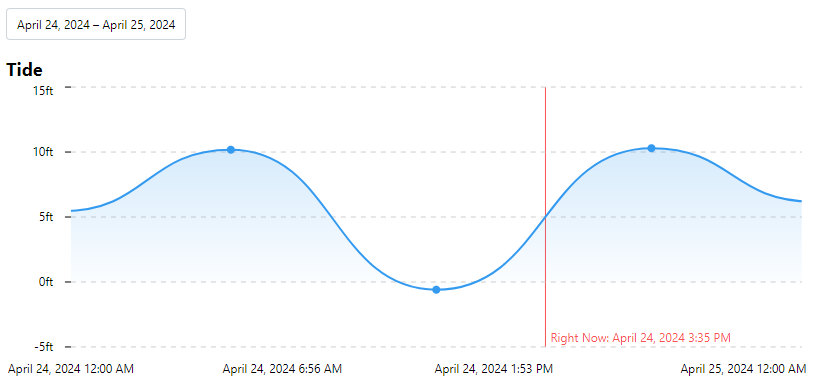
There are a couple things to note:
- Only the dots along the line are real predictions; the contours on the graph are to help interpret the data, but aren't necessarily accurate in themselves.
- The tide height displayed is relative to the Mean Lower Low Water (MLLW) as recorded by NOAA. This isn't always zero, since low tide is not always the lowest possible.
Current
The current graph displays NOAA current predictions.
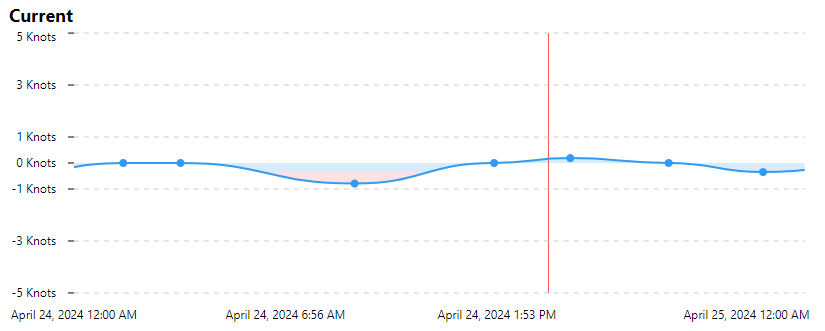
Slack tide roughly corresponds to when current is zero, and vice versa. This isn't always visible in the current graph, so make sure to study both graphs carefully. Direction is not indicated, so keep in mind that perceived current may vary.
Visibility
The visibility graph is one of our website's unique features. It displays predicted visibility based on various parameters including the tide and current predictions above.
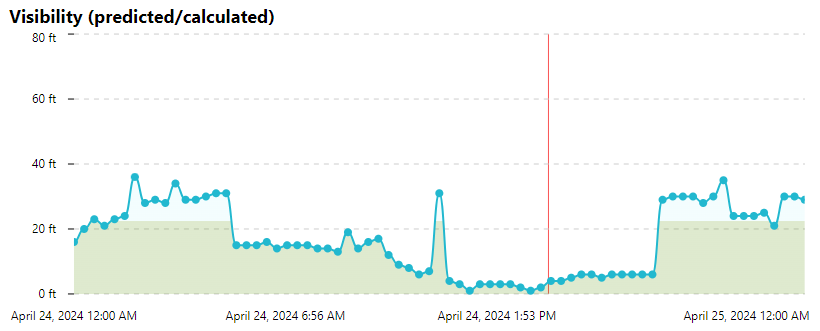
Our statistical measures have found a high degree of correlation between historic measures of visibility and our predictions, but keep in mind that site conditions may diverge in the real world. For example, the spike in visibility at noon in the graph above should be viewed with skepticism; such a rapid change for a brief window is unlikely.
Local conditions like rain and runoff may also reduce the accuracy of our prediction.
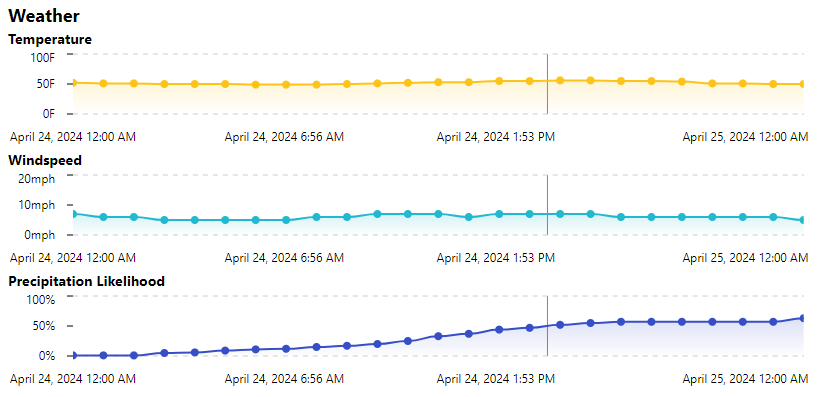
Weather
Although they are going underwater, many divers also like to consider surface weather conditions as well. We provide three key graphs to give divers an idea of what to look for:
- Temperature
- Windspeed
- Precipitation likelihood